6 minutes
IOT Fleet Metrics (Part1)
TL/DR
This guide documents a simple Prometheus PushGateway setup on top of Civo's k3s offering. We will then push some data to the gateway and visualize it in Grafana.
The end result for this project is an environmental monitoring system that gathers sensor data. I won't actually deploy the scrape jobs in this guide, but we will send a metric with curl and visualize it in each of the core components. The subsequent blogs will document building a native kubernetes operator to manage the sensor inputs.
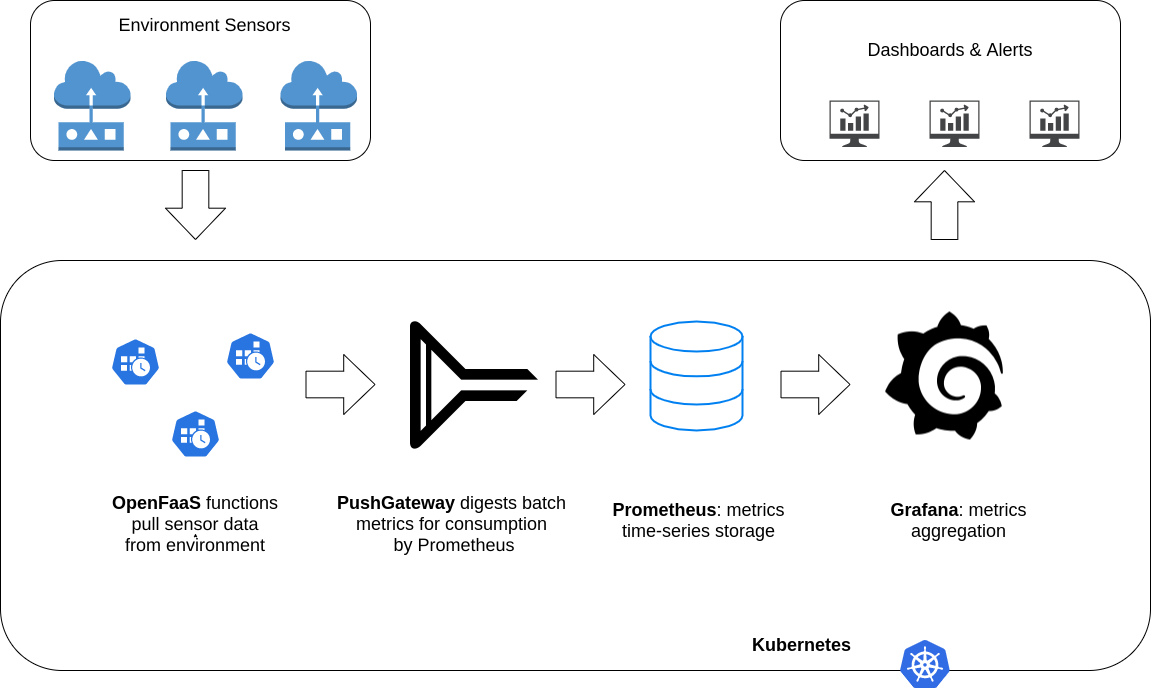
Table of Contents
- TL/DR
- Table of Contents
- Summary
- Pre-requisites
- Provision Cluster
- Deploy Core Applications
- Visualize data
- Wrapping up
Summary
Prometheus PushGateway is a very useful tool to visualize batch metrics. This guide will walk through setting up a pushgateway instance and logging metrics from a simple BASH script. This is a great way to quickly visualize data external to kubernetes in a dead simple, sysadmin friendly way. The actual purpose of this project is to pull IOT sensor data into Prometheus, but I have tried to keep things as generic as possible in this first guide. In the next post I will begin building out the data logging functions into a kubernetes native operator.
The stack is deployed to Civo cloud which runs a slimmed down flavor of kubernetes, called k3s.
Components:
- K3s Cluster installed through Civo Cloud
- Prometheus Operator (installed alongside the cluster via Civo marketplace)
- PushGateway (installed via Helm)
- Grafana (installed via Helm)
Pre-requisites
Tools
| Tool | Version |
|---|---|
| Civo-CLI | v0.5.1 |
| Kubectl | v1.16.3 |
Notes:
- Kustomize: is part of the kubectl binary since v1.15. Generally helm is used for doing the heavy lifting creating an application, and kustomize steps in for the lighter pieces that require last minute transforms.
- K3s ships with a helm operator that takes a CRD which can be applied with
kubectl. This guide will deploy grafana and pushgateway using this method. More information can be found here
Setup
Before getting started let's export some variables so they will be available throughout this guide. We also want to update our helm repo with the latest charts:
export CLUSTER_NAME=civo-iot-$(whoami)
export NAMESPACE=default
Provision Cluster
The first step is to provision a K3s cluster using the Civo CLI.
This will take a couple minutes, once finished the --save flag wil point your kubectl context to the new cluster.
civo kubernetes create \
    --applications prometheus-operator \
    --nodes 2 \
    --save --switch --wait \
    ${CLUSTER_NAME}
We are initializing the cluster with the prometheus-operator application from the Civo Marketplace. Once the cluster has finished booting you can explore the default cluster monitors, provisioned by the prometheus operator. First port-forward to the grafana instance: kubectl port-forward svc/prometheus-operator-grafana 8080:80 --namespace monitoring and navigate to http://localhost:8080 . You can log in with the username admin and the password prom-operator. Not every dashboard will work since the k3s distribution has a slightly different topology then a vanilla kubernetes cluster.
In the next steps we will provision our own instances of Prometheus and Grafana.
Deploy Core Applications
The stack consists of a few core applications, and jobs to fetch the data.
- Grafana: is a powerful visualization tool we will use for displaying our metrics. This could be considered the ‘frontend’ of our application.
- Prometheus: is a time-series database that scales incredibly well. This is our ‘backend’. Prometheus is generally configured to scrape metrics data from applications on regular intervals.
- PushGateway: is a ‘sink’ or ‘buffer’ for metric data that is too short lived for Prometheus to scrape. This is what our cron jobs will log data to since the containers wont live long enough for Prometheus to ever see them.
Install Grafana
# deploy/charts/grafana.yaml
#
cat <<EOF > /tmp/grafana.yaml
apiVersion: helm.cattle.io/v1
kind: HelmChart
metadata:
  name: grafana
  namespace: kube-system
spec:
  chart: stable/grafana
  version: 4.0.4
  targetNamespace: default
  valuesContent: |-
    datasources:
      datasources.yaml:
        apiVersion: 1
        datasources:
        - name: Prometheus
          type: prometheus
          url: http://prometheus-operated:9090
          access: proxy
          isDefault: true
EOF

# Apply the chart
kubectl apply -f /tmp/grafana.yaml
Install Prometheus
When we provisioned the cluster we installed the prometheus operator which installs an instance of prometheus by default. This instance is used for monitoring the cluster so we generally want to avoid using it for application data. Luckily operators make it super easy to spawn new instances. We simply need to create a Prometheus CRD and attach some RBAC permissions.
This is what the directory tree looks like:
deploy/manifest/prometheus
├── kustomization.yaml
├── prometheus-rolebinding.yaml
├── prometheus-role.yaml
├── prometheus-sa.yaml
└── prometheus.yaml
To install we can build the directory with kustomize and pipe it directly to the cluster:
TARGET="github.com/gabeduke/civo-iot/deploy/manifest/prometheus/?ref=1.0.0"

# # If you have the repository checked out then you can uncomment the following line
# TARGET=deploy/manifest/prometheus

kubectl kustomize ${TARGET} | kubectl apply -n ${NAMESPACE} -f -
Install Push-Gateway
# deploy/charts/pushgateway.yaml
#
cat <<EOF > /tmp/pushgateway.yaml
apiVersion: helm.cattle.io/v1
kind: HelmChart
metadata:
  name: metrics-sink
  namespace: kube-system
spec:
  chart: stable/prometheus-pushgateway
  version: 1.2.5
  targetNamespace: default
  set:
    metrics.enabled: "true"
    serviceMonitor.enabled: "true"
    serviceMonitor.namespace: "default"
EOF

# Apply the chart
kubectl apply -f /tmp/pushgateway.yaml
Visualize data
Lets validate that the services are all working by pushing a data point to PushGateway manually.
Wait until alll pods are running and then start the proxies:
# Proxy Grafana
kubectl port-forward svc/grafana -n ${NAMESPACE} 8080:80 &

# Proxy Prometheus
kubectl port-forward svc/prometheus-operated -n ${NAMESPACE} 9090:9090 &

# Proxy PushGateway
kubectl port-forward svc/metrics-sink-prometheus-pushgateway -n ${NAMESPACE} 9091:9091 &
Once the proxies are active you can drop a metric onto the pushgateway:
echo "sample_metric 1" | curl --silent --data-binary @- "http://localhost:9091/metrics/job/sanity-test"
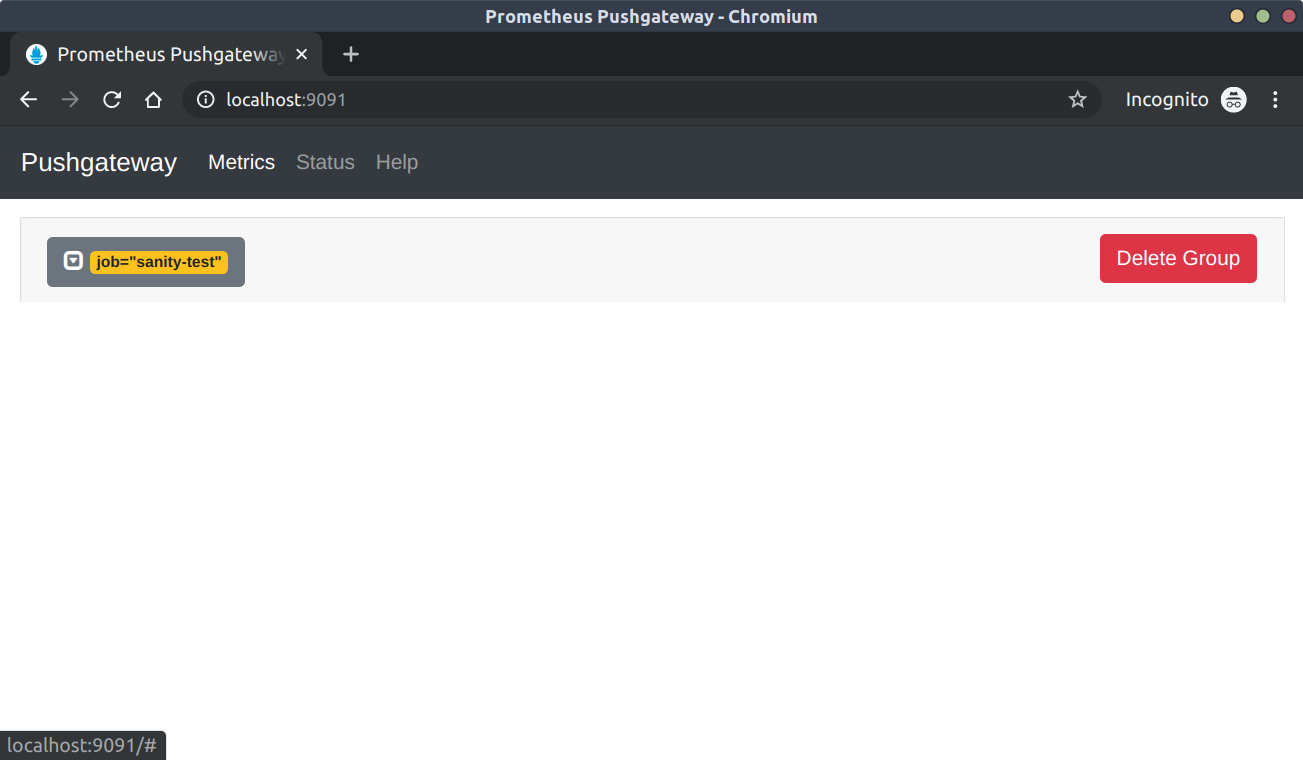
Visualize in PushGateway
http://localhost:9091
Notice there is a new group for sanity-test and the data point sample_metric is equal to 1.
To see the raw metrics that prometheus will scrape, navigate to http://localhost:9091/metrics and notice the new line:
# TYPE sample_metric untyped
sample_metric{instance="",job="sanity-test"} 1
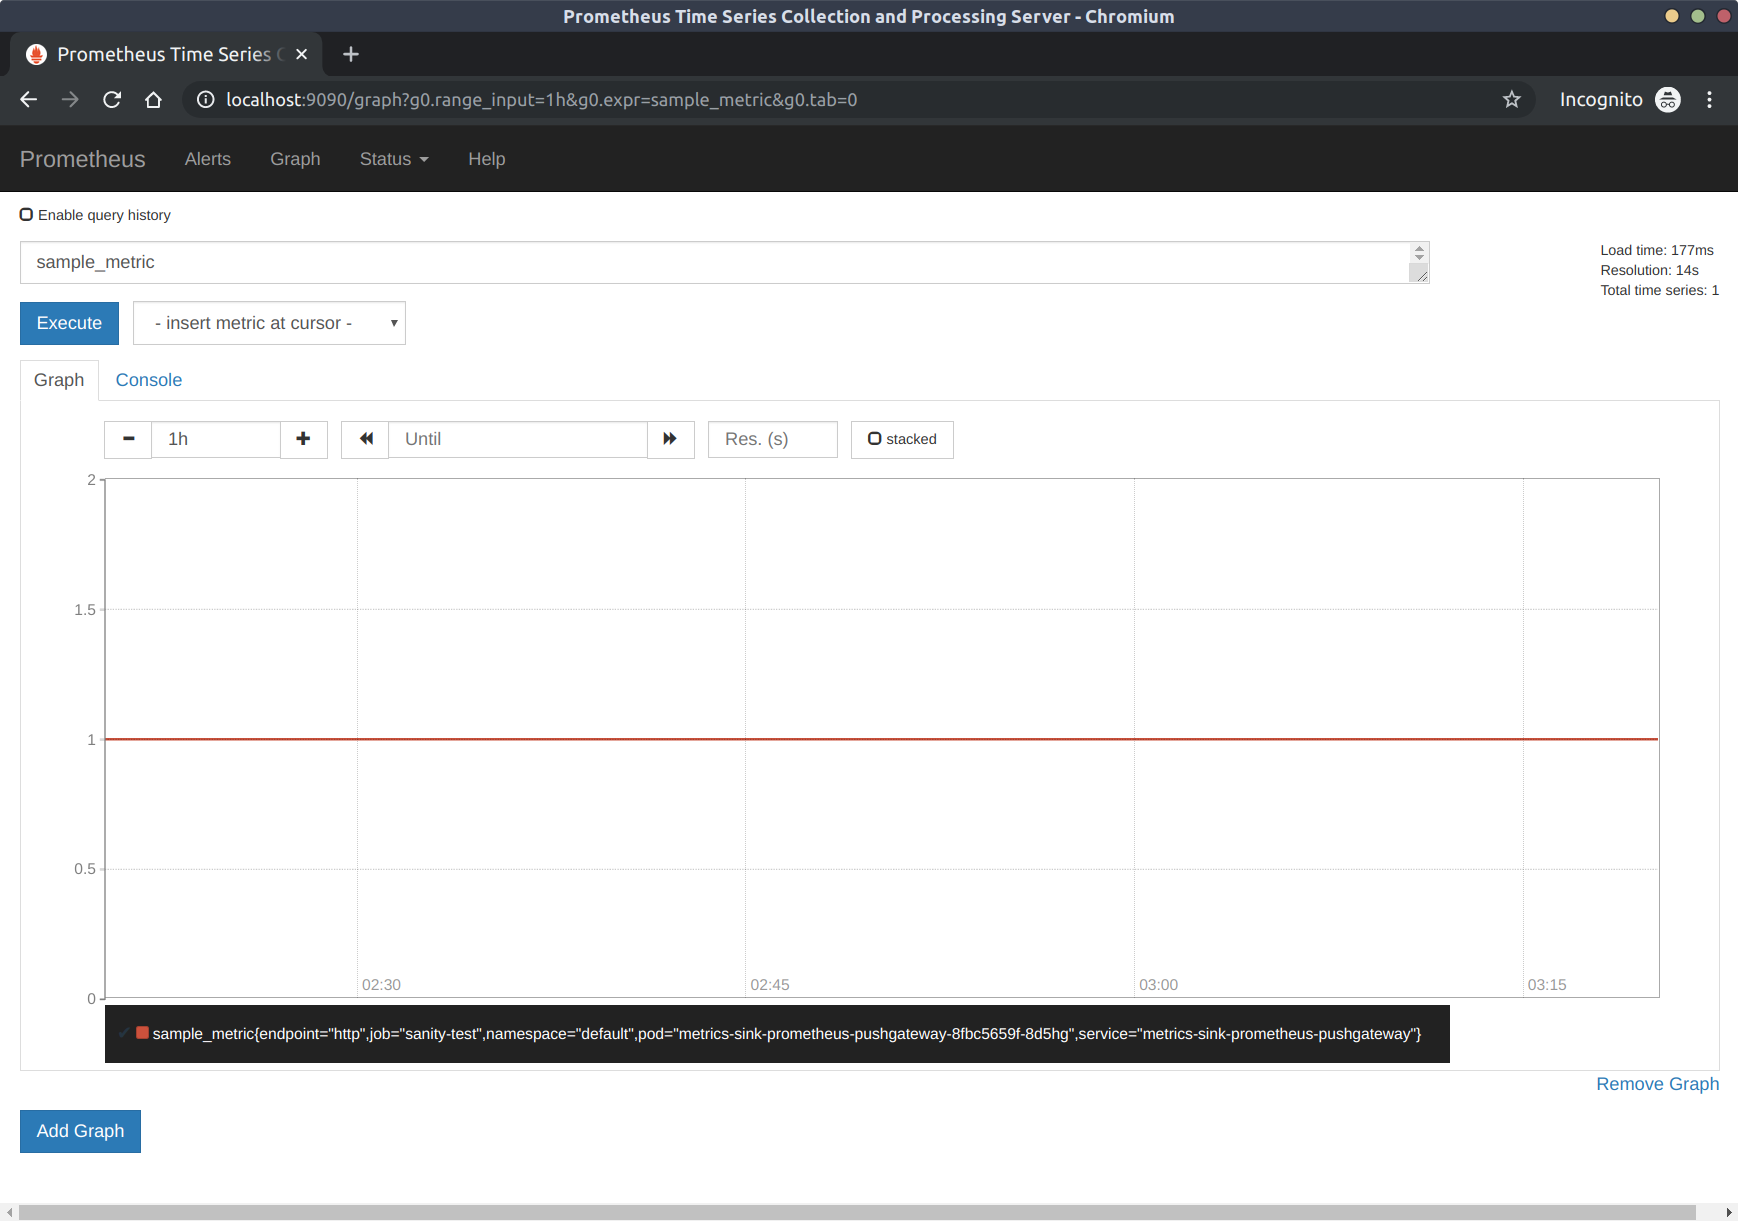
Visualize in Prometheus
http://localhost:9090
Prometheus is where the data will be aggregated and we can perform queries over time. Since we only have a single data point we will see a line in the graph when searching for sample_metric. As we build out the monitoring system we can add CRDs to generate alerts on our data.
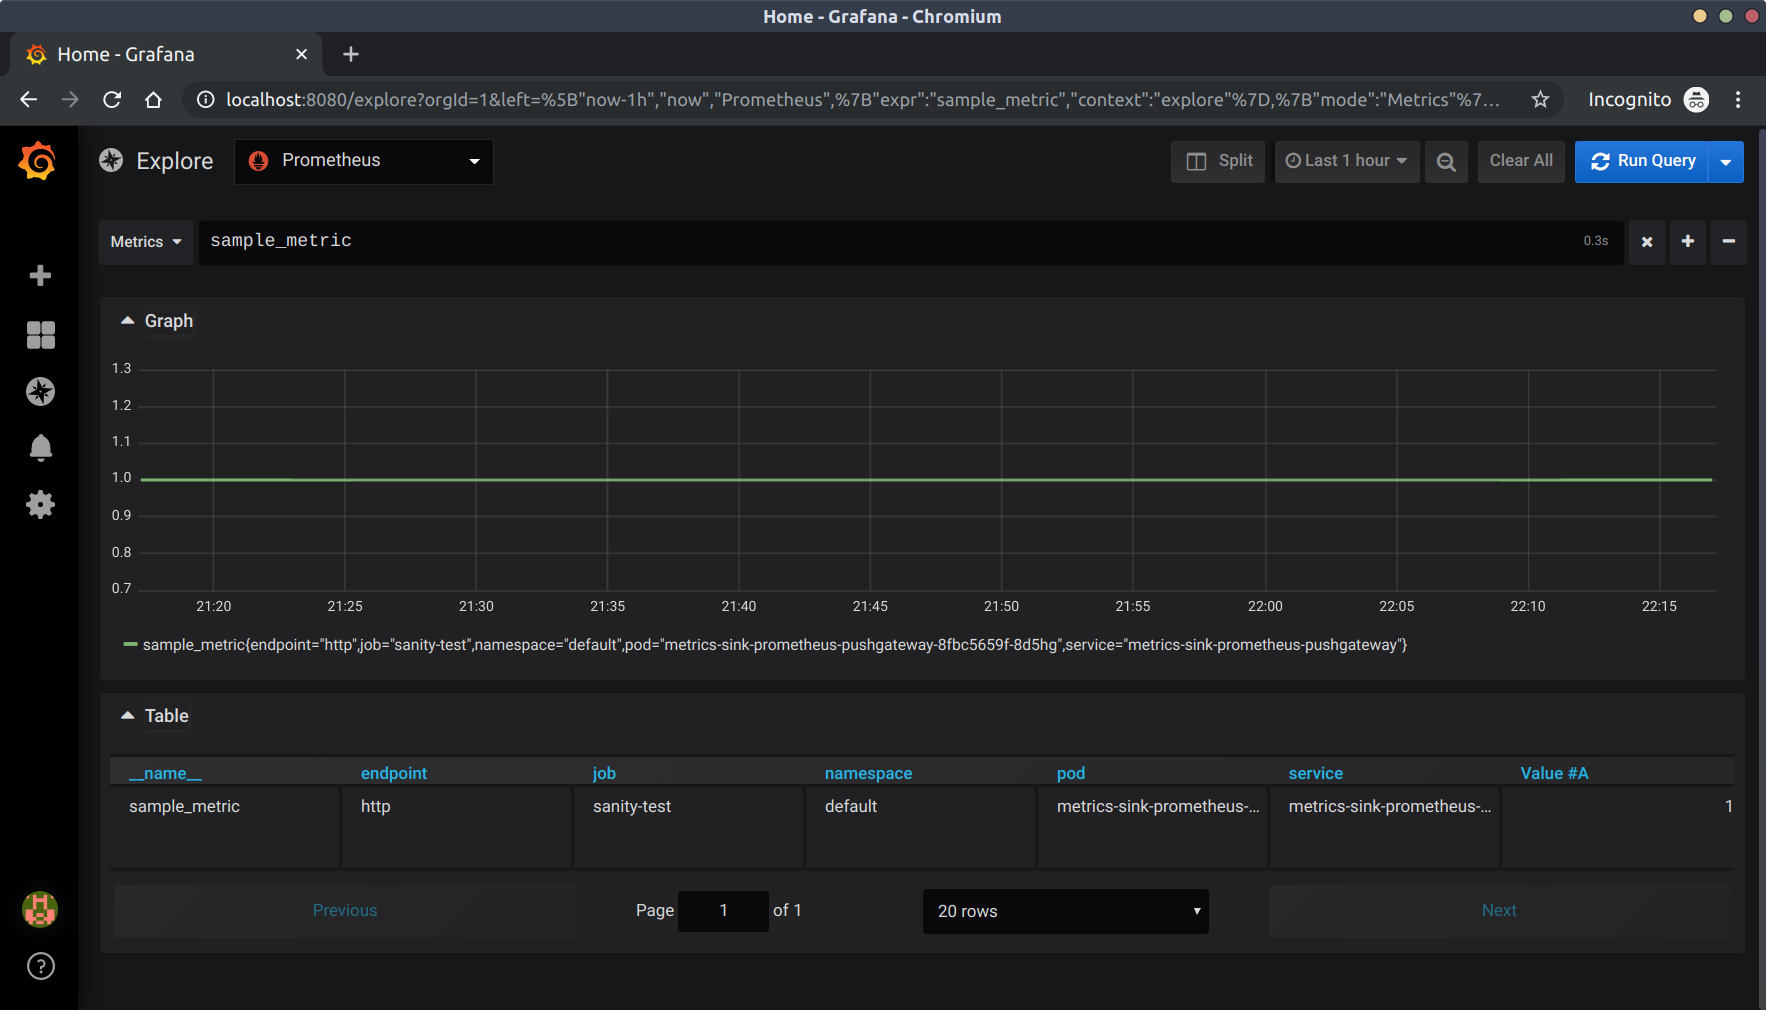
Visualize in Grafana
Grafana is where we will compile dashboards to display Prometheus queries.
To get the password from the next step: kubectl get secret --namespace default grafana -o jsonpath="{.data.admin-password}" | base64 --decode ; echo
Log in with the username admin and password will be ${PASSWORD}. Again the visualization is not very interesting with a single data point but this is a simple sanity test.
To validate our sample metric we are going to use the Explore function. Navigate to http://localhost:8080/explore
Wrapping up
Congradulations! You now have the foundation for a batch metrics monitoring system! Keep an eye out for the next post where I will walk thorugh connecting real sensor data.